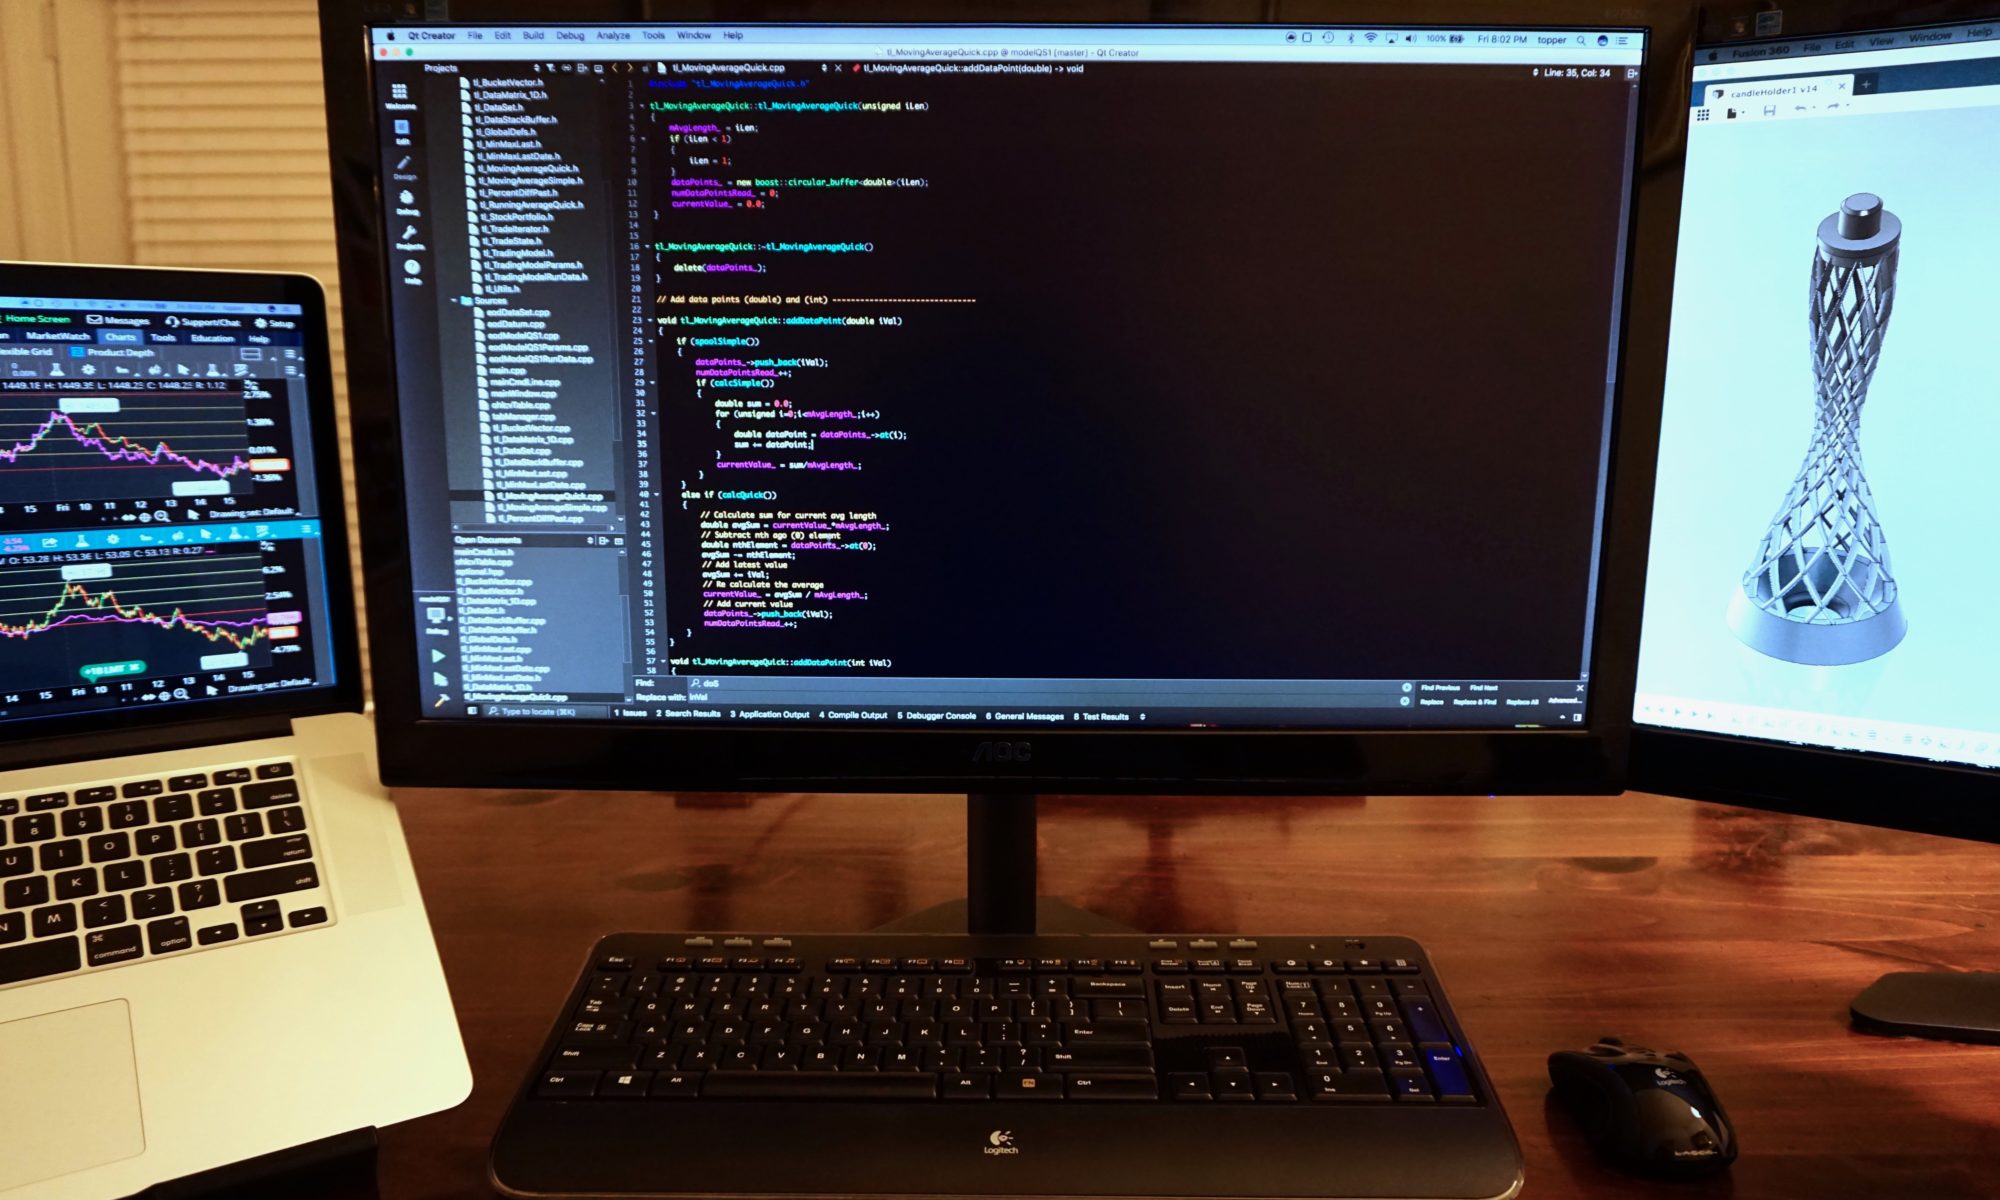
In order to illustrate my thinking about designing algorithmic trading strategies I have written an article on how to implement a basic system. Follow the link below to read a step-by-step tutorial on how to write a simple crossover strategy in C++ using Qt and Boost. I hope to follow up with more articles on the subject that look at visualization tools to evaluate model performance and how to optimize model parameters via a distributed computing network.
Read my tutorial on how to implement a simple crossover strategy using Qt and Boost.
My introduction to algorithmic trading and trading models in general came in the late 1980s a few months after Black Monday. The tools available to test and optimize strategies then were in the very early stages of development both in terms of design and computing power.
Read more details about my history with trading algorithms here.
My current algorithms are written and optimized in C++ using Qt and the Boost libraries. This combination of tools allows me to build applications that are cross-platform and can be optimized on my Linux-based computing cluster.
Proprietary algorithms are some of the most highly guarded secrets in the financial world. Discussing the details of a particular methodology runs the potential risk of giving away valuable intellectual property. The following is a quote from a recent Bloomberg article.
“Assets managed by computer-driven funds have expanded in scope in financial markets, with the trend rolling back the human element in identifying and executing strategies. Among the big directions the industry will now take is quant trading moving beyond its role of identifying alpha — pinpointing opportunities for returns above the benchmark — to replacing more of the many tasks that are now being done by human beings…”
More and more money is traded via algorithm than ever before. I contend that the widespread implementation of machine trading makes the rules they use easier to discern. So why not make some investment decisions based on how those algorithms appear to work?
The following is an example of one graphical method I use to analyze a given optimized model’s performance over time. The interactive graph below plots a model portfolio’s value along with its percentage change over 120, 240 and 500 days respectively. The goal here is to weed out those that may have simply “gotten lucky” with a few very successful trades.
The graph was generated using the R statistical package and dygraphs. The range bar at the bottom allows you to dynamically change the start, end and length of time displayed. You can also highlight a specific area to instantly set the time window to that period.
